We live in a 3D world!
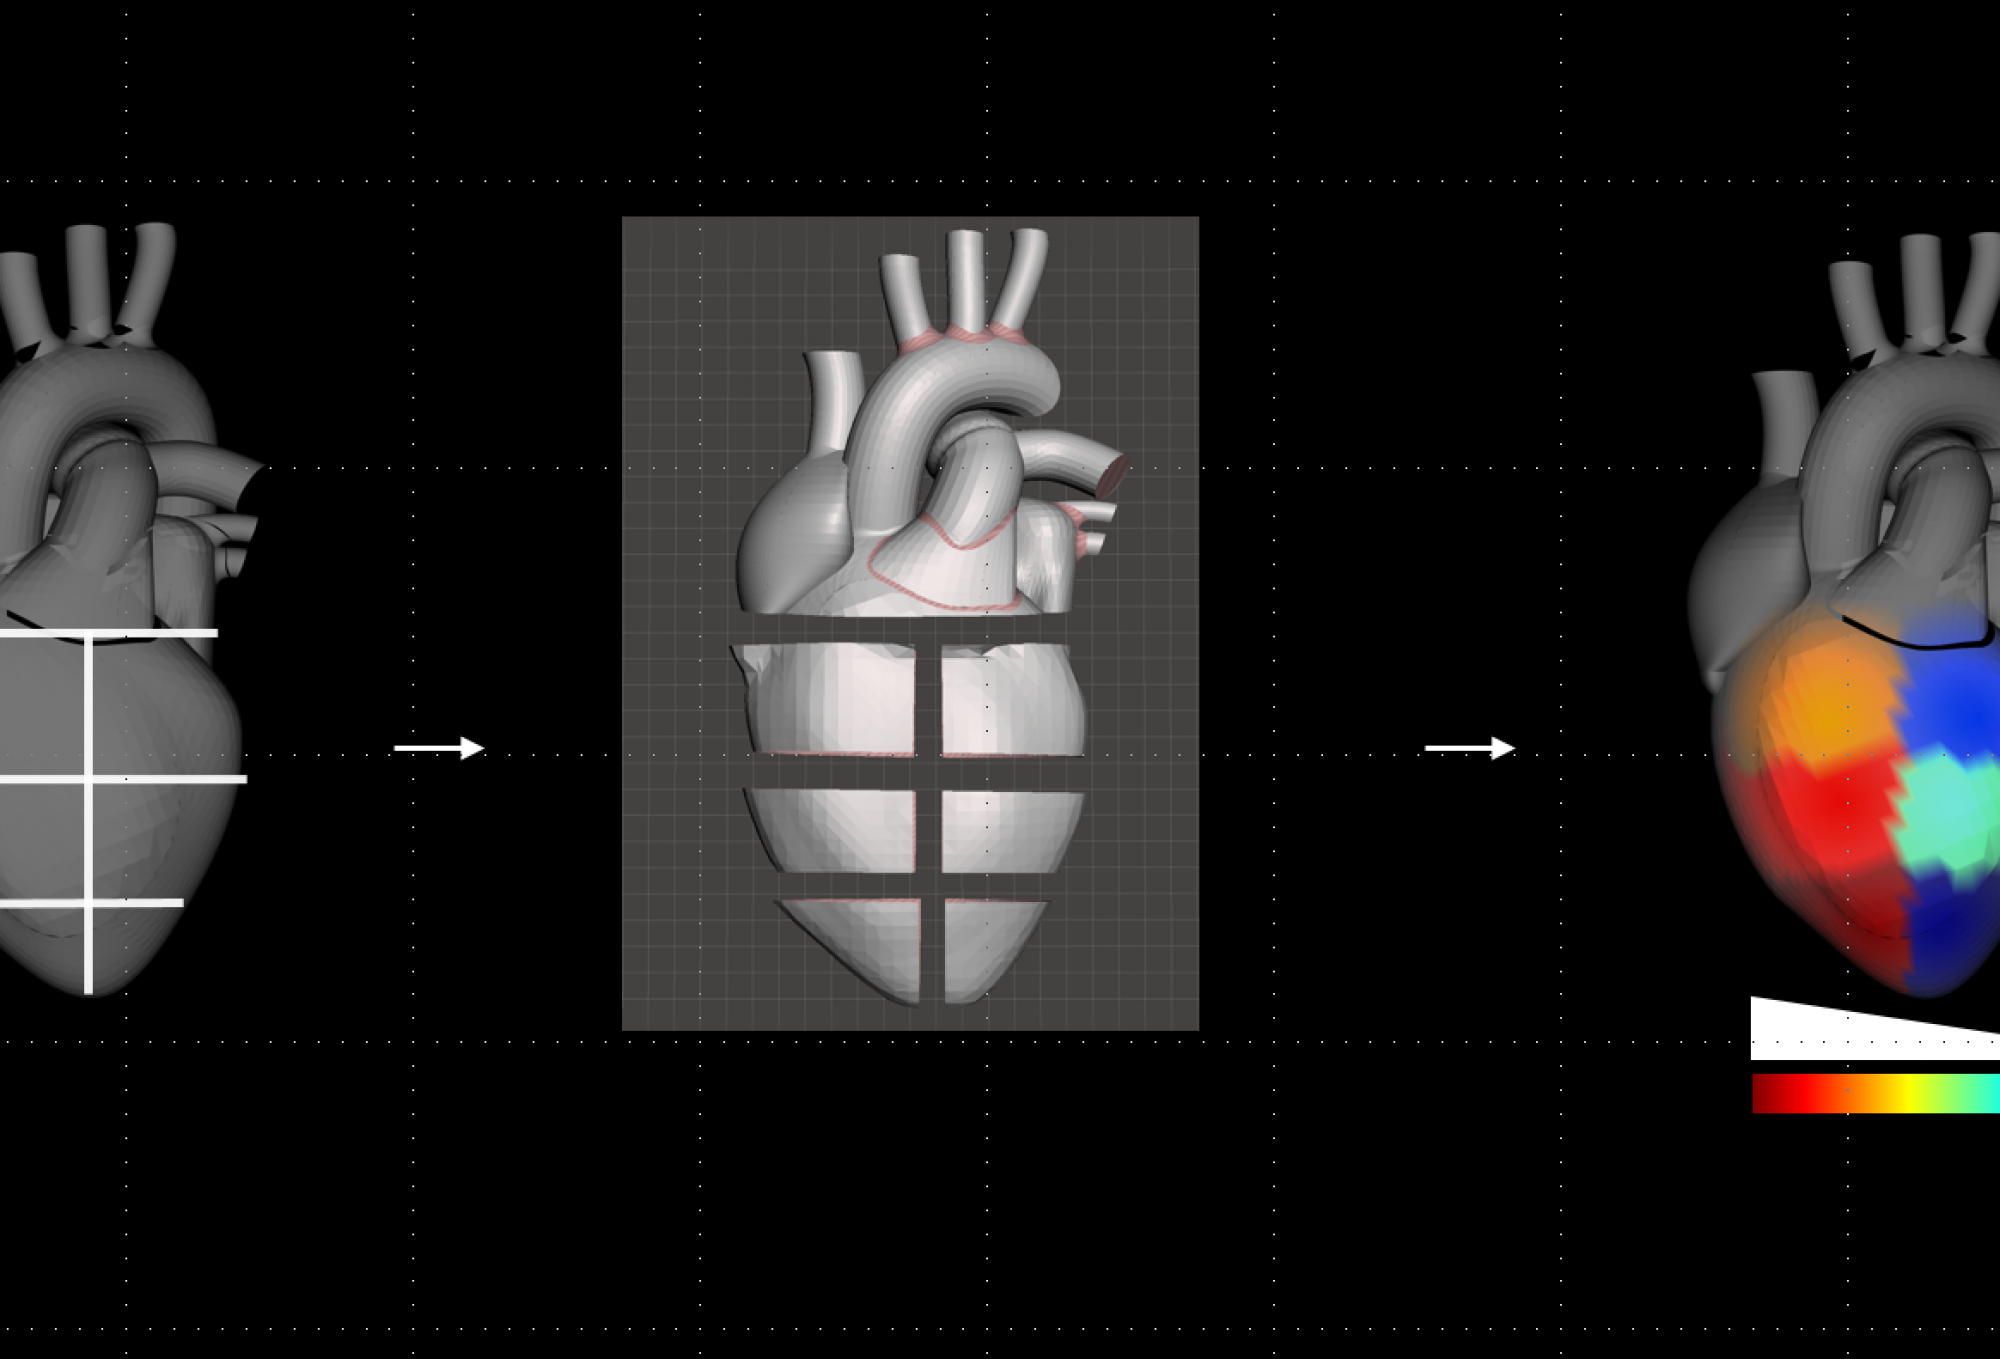
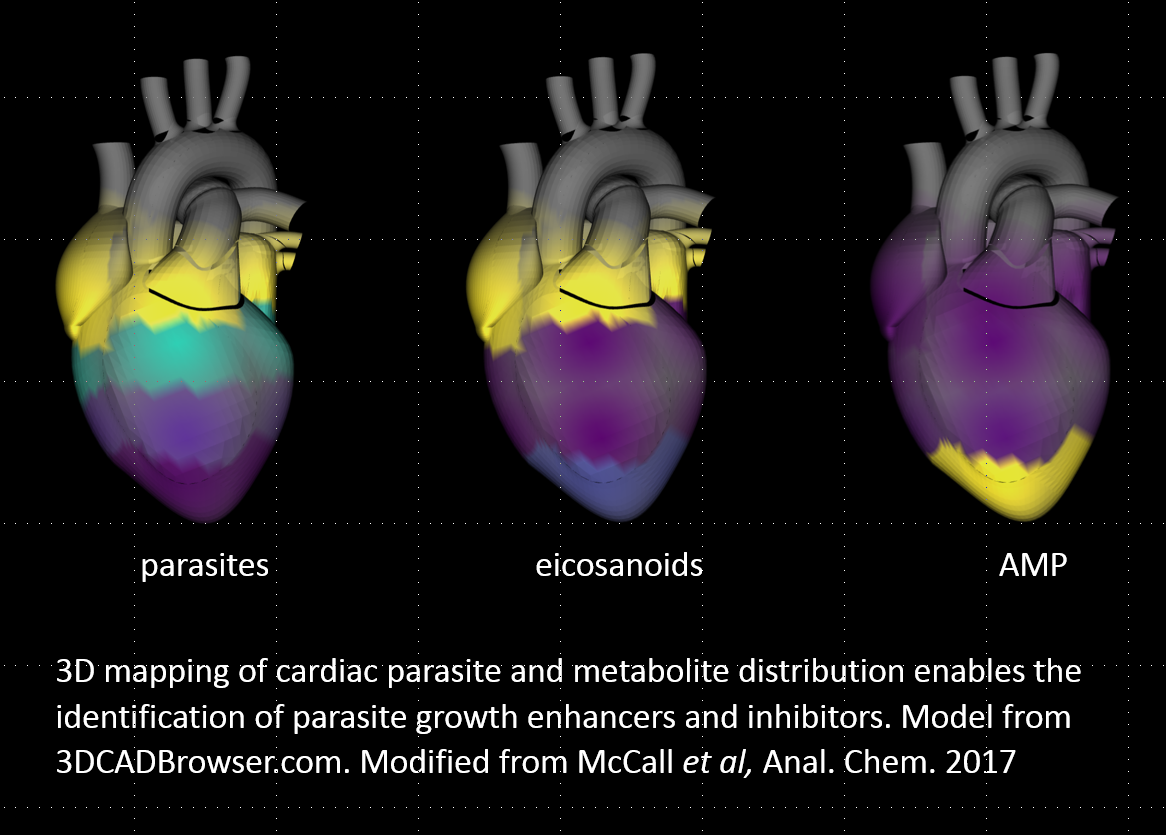
We use our chemical cartography approach to understand the spatial context of disease development, by investigating the chemical interplay between mammalian hosts, their environment and microorganisms in 3D. Using mass spectrometry-based metabolomics, combined with big data statistical tools and three-dimensional modeling, we place molecules in their spatial context and link them to microbial community composition and human health.
This approach helps us answer big questions, like: Why do diseases happen where they do in the world? Why do pathogens colonize one organ but not another? Why do some organ locations recover from infection and others stay permanently damaged?
We answer these questions in neglected tropical diseases (Chagas disease, leishmaniasis) and during viral and bacterial infections, with many other exciting possible applications!

Current drug development approaches don’t always work…
Why do some patients fail to improve after symptoms resolve or after antimicrobial treatment? How can we quickly determine if treatment was successful? Can we find better treatment regimens that address disease symptoms and don’t lead to drug resistance? How can we improve the efficiency of drug development processes? We use metabolomics to address these questions, and many more!
